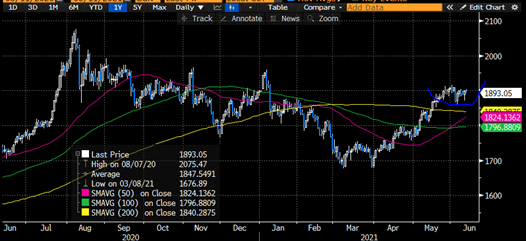
US Core CPI surges to 5%, treasury bonds rally and 10-year yield drops below 1.45%
Yesterday was the big ECB day, but Bloomberg TV concentrated on the US core CPI data which were released at the same time with the ECB press conference. The ECB basically confirmed that they will not taper their bond purchase programs and announced that they increase the Eurozone GDP forecast and expect inflation to be slightly above 2%. We expect European equites to continue outperforming the US for a while as the Eurozone area is far behind the US with the reopening.
Speaking of the real story: US Core CPI is at the highest level since 1992 and Treasury markets go crazy, i. e. we see a sharp drop in the 2-30-year treasury bond yields. Therefore, real yields drop further into the negative territory.
Amazingly gold closes the day flat while intraday we have lost around USD 20 per ounce. However, we think that gold is in a consolidation phase after the strong rise to USD 1’900 and will soon try to rally further up toward USD 2’000.
Fig. 1: US CPI data comes in higher than expected
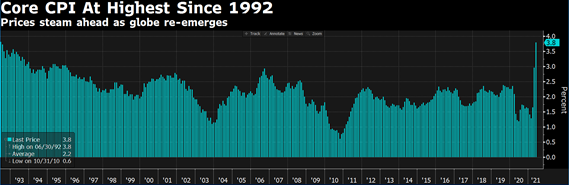
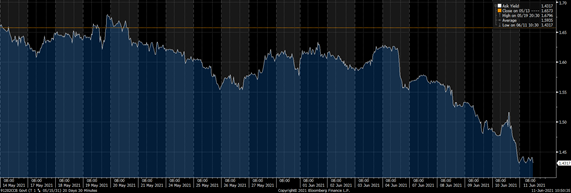
Fig. 2: 10-year US Treasury yields fell below 1.45% after higher CPI data
US TIPS, which we considered for quite some time as overvalued, did correct in the meantime and the expected inflation rate is rolling over. The transitory narrative of the Fed gets priced in. Some analysts think that the inflationary effect of rising commodity prices and the loosening statistic base effect might result in lower CPI data down the road. The jury is still out.
Fig. 3: TIPS markets do send a clear signal that the Fed might be right with its “transitory story”
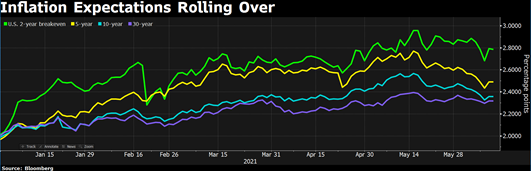
Fig. 4: US 10-year real yield (based on core CPI) fell sharply
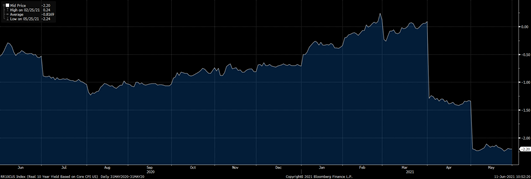
Fig. 5: Gold did not profit from the higher US CPI data
Meanwhile the economy is growing across the globe like the latest Indian industrial data demonstrate. The graphic is distorted due to the “pandemic lockdown statistic base effect”, but it is still remarkable how strong the industrial production was growing (121% YoY) in April while at the same time we have seen a strong 2nd COVID wave. Similar picture was observable in Europe, where the industrial output was only minor affected by the recent lockdowns.
Fig. 6: India’s industrial production seems not to be affected by the actual Covid wave
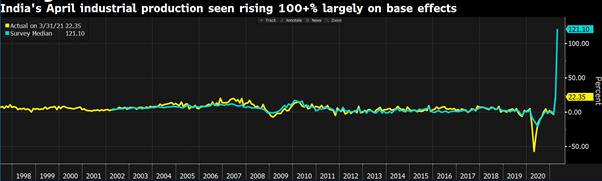
Fig. 7: PMI data at record level, they might roll over
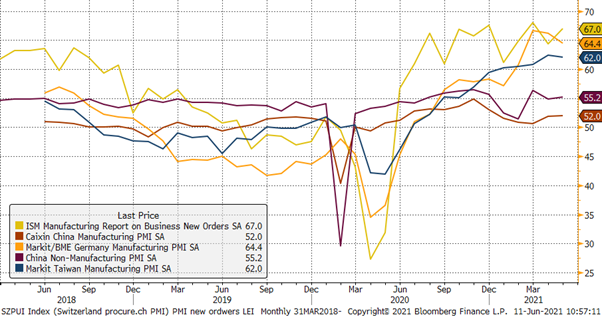
Since our last BFI we have seen new estimates for global growth from the OECD and the IMF, both had to adjust their cautious forecasts to levels which are more in line with the PMI data, a statistic which is completely ignored by macro economists. In some areas we do see the highest PMI reading since this data is collected, and we therefore must expect that the next release will show lower data, but we still expect them to stay above 50 (border of growth).
Having said that we continue to see higher equity markets into the summer followed by a consolidation or correction later in the year. The shortage of various input factors will keep pushing PPI data higher, but it also offers opportunities. In Taiwan where the PMI is at 62 and most microchip producers are located, we do expect a strong recovery of chip makers.
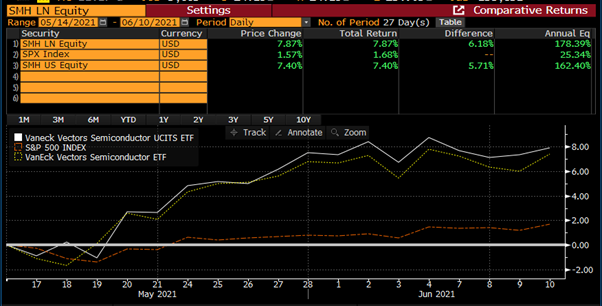
In May we have established a new tactical bet on the global chip sector. After a bit more than 3 weeks we do already see a strong performance of the global chip sector outperforming slightly its US pendant and as expected outpacing strongly the S&P 500. If history is any guide this outperformance period will last around 18 months, we therefore keep this tactical idea on our agenda.
Fig. 8: Global Semiconductor producers outperform its US pendants and the S&P 500
Overall, we would not be surprised to see a mean reversion in treasury yields and a further climbing the wall of worries of global equities. After yesterday’s ECB press conference and the stronger expected European growth, the likelihood of European equities continuing to outperform US markets has risen. Also, Brazilian and Indian equities might continue their strong rally as these markets start pricing in a strong economic recovery after having suffered from a new severe COVID wave.
Disclaimer: This Blackfort Insights (hereafter «BI») is provided for information purposes only. This document was produced by Blackfort Capital AG (hereafter «BF») with the greatest care and to the best of its knowledge and belief. Although information and data contained in this document originate from sources that are deemed to be reliable, no guarantee is offered regarding the accuracy or completeness. Therefore, BF does not accept any liability for losses that might occur using this information. BI does not purport to contain all the information that may be required to evaluate all the factors that would be relevant for entering into any transaction and anyone hereof should conduct their own investigation and analysis. In addition, the BI includes certain projections and forward-looking statements. Such projections and forward-looking statements are subject to significant business, economic and competitive uncertainties and contingencies, many of which are beyond the control. Accordingly, there can be no assurance that such projections and forward-looking statements will be actualized. The real results may vary from the anticipated results and such variations may be material. No representations or warranties are made as to the accuracy, or reasonableness of such assumptions, or the projections, or forward-looking statements based thereon. This document is expressly not intended for persons who, due to their nationality or place of residence, are not permitted to access such information under local law. It may not be reproduced either in part or in full without the written permission of BF.
© Blackfort Capital AG. All Rights reserved.
All Rights reserved.
Media about us:
-
-
Capital for The Energy-efficient Renovation of Swiss Homes
Uncorrelated earnings in Swiss Francs and more capital for the energetic refurbishment of Swiss houses – In the interview Wanja Eichl, Managing Partner, explains why Blackfort launches the new Swiss Real Estate Debt Fund. Please check it out via the following INTERVIEW Blackfort Swiss Real Estate Debt_e
-
More Capital for The Energetic Refurbishment of Swiss Real Estate
Contact us
Blackfort Capital AG Blackfort Schweiz AG
Talstrasse 61, 8001 Zurich Prime Tower, 8005 Zurich
Tel. +41 44 585 7878 Tel. +41 44 442 3202


