
Market Watch. December 2019 I
Market Watch. December 2019 (I)
Kazakhstan and Uzbekistan – two emerging neighbors
Kazakhstan: In July 2018 the Astana International Financial Center (AIFC) opened with the goal to become a hub for financial services in Central Asia. In 2019 Blackfort Capital was the first foreign asset manager who received a local license, opening its local presence.
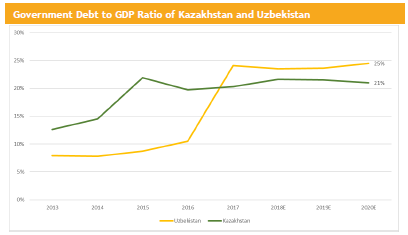
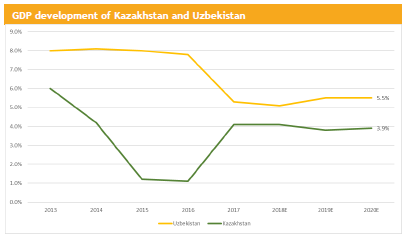
The country is on a solid growth path of around 4%. Recently the government has issued international bonds in US dollars. It is important to notice that it happened without increasing the debt to GDP ratio, which stayed at 21%.
Its neighbor Uzbekistan has opened up to international investors as well. With an expected GDP growth of above 5% for 2020 and a constant debt to GDP ratio of around 25% we consider both countries and its companies as interesting additional places to deploy money.
Recently Moody’s has reaffirmed the Baa3 rating for Kazakhstan and changed the outlook to positive. The key drivers are: low government debt level, relatively high growth rate and political stability. The county is exposed to oil price shocks and has a relatively weak banking sector, while the institutional regulation is improving. The fiscal situation is strong due to a robust growth and prudent budget policy, which is reflected in good credit metrics.
The rating outlook for Uzbekistan’s government bond was as well reaffirmed by Moody’s at B1 with a stable outlook. The country has a robust growth and a young working age population. The government debt was kept at relatively low levels and was financed at low costs. To absorb economic turbulences the government holds a sizable amount of foreign reserves.
Differently to its neighbor, the institutional framework of Uzbekistan is weaker and must still be improved The main export products are gold, natural gas, cotton and copper. Geographically favorable location in the heart of central Asia makes the country together with its young working population an interesting spot for foreign investors.
In the US Q3 GDP was revised up to 2.1% from 1.9%. However, the main driver was the build up of warehoused goods. This was negatively commented. Nevertheless, forward looking indicators like the latest flash PMI data or the chip sectors outlook still point to a moderate acceleration of US growth in 2020.
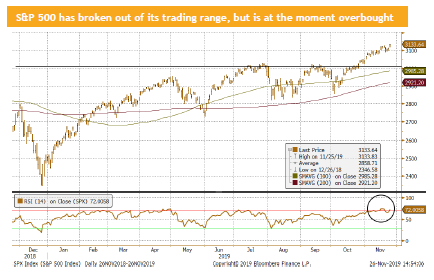
During the recent trading sessions, S&P 500 was achieving new record highs almost on daily basis. Hope of a phase is that one deal keeps the market on fire. However, we would like to stress that after the market has risen for 6 weeks in a row, based on RSI “overbought” concept, it will sooner or later face a consolidation.
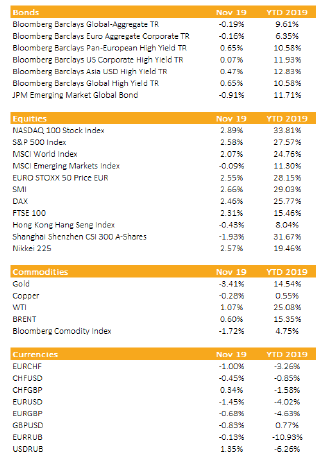
In November most developed equity markets have risen 2-3%. For the whole year the picture looks even more impressive, while US and Swiss equities lead the pack with a return of around 30%
Investment grade bond were slightly negative. Corporate (high yielding) bonds showed a mixed picture, Form a region standpoint, European high yields and Asian corporate bonds had a strong month.
Liquidity
The Chinese RMB appreciated against the USD. It seems that the Chinese government is willing to lose market share in the US by not further depreciating its currency and by letting the US consumer pay higher prices on Chinese goods sold in the US. The trade war is backfiring as the consumer (mainly US) pays the bill and in both countries GDP growth is reduced.
The political driven rally in GBP might come to an end as its fundamentals continues to deteriorate, based on the latest economic surveys.
The USD keeps appreciating based on a slightly better economic outlook for 2020. Another key driver is the impact of the paid tariffs. Having said that, currency strategists expect the US dollar to weaken in the event of a singed trade deal.
Equities
Most developed market trade are either at a new record highs or at least at a new 52 weeks high. Most are overbought. But hopes on a trade deal hinders the market from falling. The S&P rose 8% since September and Dax went up even 10%.
Some call it the Teflon market driven by the fear of missing out (FOMO). Almost on a daily basis we get new hints that the first phase of trade deal is finally close to its announcement. In such case we might see a “sell-the-fact” correction.
Fixed Income
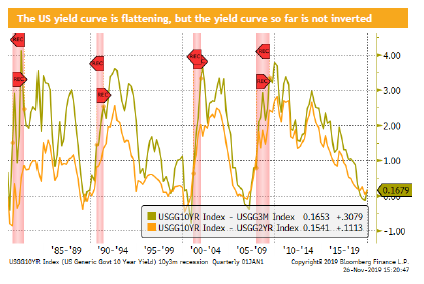
The US yield curve has slightly flattened as can be seen in the 3-month 10-year and 2-year 10-year US government bond yield spread. It is worth noting that both spreads are still positive.
Globally, the amount of negative yield bonds has decreased from around $ 17.5 trillion to $ 12 trillion. This is partially driven by a better growth outlook in the Eurozone, Japan and Switzerland. The other hope is that we will see some fiscal stimulus in Europe. In France such program was announced and in Italy the budget deficit is expected to stay above the Maastricht criteria of 3%. But in Germany no concrete action plan has been presented,
Alternative Investments
Gold: The consolidation continues, since the beginning of the month gold lost more than 3%. It is remarkable that over the last two weeks the Gold price has been flat, while risky assets are growing further up.
Oil: Despite negative market comments, WTI and Brent went further up. Since the beginning of November Bret has increased by roughly 6%.
Cooper: Dr. copper, which used to be a very good leading indicator, has risen since the publication of the PMI data, but still trades below its September levels.
Investments covered:
JSC Halyk Bank 5,5 2022 (JSC Halyk Bank 2022 5,5 )
Braskem Idesa 7.45 2019 (Braskem Idesa 2019 7.45 )
Uzbek Industrial and Construction Bank 5.75 2024 (Uzbek Industrial and Construction Bank 2024 5.75 )
Alibaba Group Holding Limited
Disclaimer
These Business Reports (hereafter «BR») are provided for information purposes only and for the use by the recipient. This document was produced by Blackfort Capital AG (hereafter «BF») with the greatest of care and to the best of its knowledge and belief. Although information and data contained in this document originate from sources that are deemed to be reliable, no guarantee is offered regarding the accuracy or completeness. Therefore, BF does not accept any liability for losses that might occur through the use of this information. The BR does not purport to contain all of the information that may be required to evaluate all of the factors that would be relevant to a recipient considering entering into any transaction and any recipient hereof should conduct its own investigation and analysis. In addition, the BR includes certain projections and forward-looking statements. Such projections and forward-looking statements are subject to significant business, economic and competitive uncertainties and contingencies, many of which are beyond the control. Accordingly, there can be no assurance that such projections and forward-looking statements will be realised. The actual results may vary from the anticipated results and such variations may be material. No representations or warranties are made as to the accuracy or reasonableness of such assumptions or the projections or forward-looking statements based thereon. This document is expressly not intended for persons who, due to their nationality or place of residence, are not permitted access to such information under local law. It may not be reproduced either in part or in full without the written permission of BF.
© Blackfort Capital AG. All Rights reserved.
Media about us:
-
-
Capital for The Energy-efficient Renovation of Swiss Homes
Uncorrelated earnings in Swiss Francs and more capital for the energetic refurbishment of Swiss houses – In the interview Wanja Eichl, Managing Partner, explains why Blackfort launches the new Swiss Real Estate Debt Fund. Please check it out via the following INTERVIEW Blackfort Swiss Real Estate Debt_e
-
More Capital for The Energetic Refurbishment of Swiss Real Estate
Contact us
Blackfort Capital AG Blackfort Schweiz AG
Talstrasse 61, 8001 Zurich Prime Tower, 8005 Zurich
Tel. +41 44 585 7878 Tel. +41 44 442 3202


