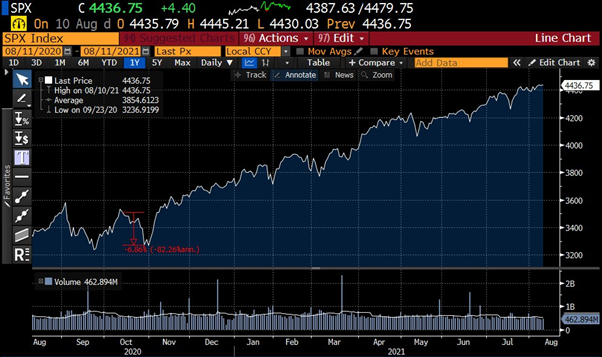
When have we observed a drop of more than 5% in the S&P 500?
The answer is – last year in September and October. Will history repeat this year? As figure 4 shows it would be a normal reaction to see some pullbacks during the 2nd half of August. But we do see a lot of complacency around us. The CNBC fear and greed index is still in the fear area, although we have seen rising markets all over the globe.
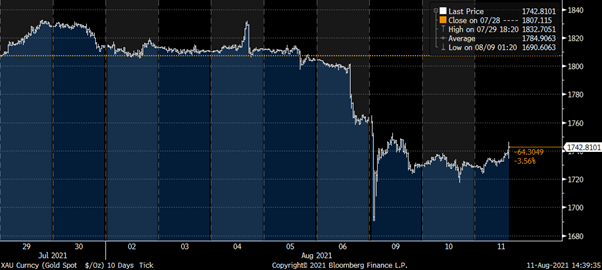
US treasury markets have seen a selloff after the stronger than expected US job report. After the weekend, accompanied by a stronger USD gold lost in a mini flash crash more than 6% intraday during the Asian trading hours. The latest US inflation data is a touch lower than expected and especially below the previous month data. Equity and gold have reacted positively, while treasury bond prices have risen due to slightly lower yields.
Fig. 1: Since November 2020 there was no pullback bigger than 5% in the S&P 500
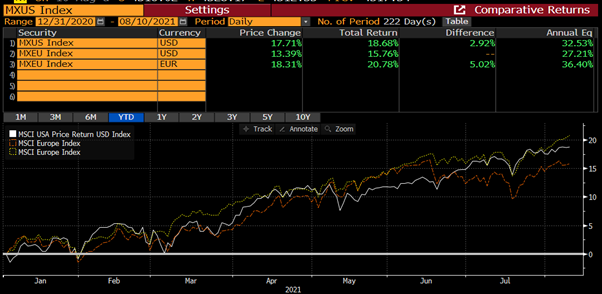
Are European shares finally breaking out of their value trap? Based on the risk premia Europe continues to be cheaper than the US. However, that was the case for most the time since March 2009 , when this equiy bull-in has started. But this earnings season was not only strong in the US but also extremly strong in Europe. For both markets the PE ratio has fallen while equity markets went up. Maybe finaly we do see a continuation of the catch up rally of Europe equities. The fiscal stimulus and money printing will support european markets. We therefore expect Euopean markets to do well in 2022. But only if there is no sharp correction in the US, which we do not expect. Therefore it might continue to be a close race between MSCI Europe and MSCI USA like it has been since the beginning of the year. It is noteworhty that measured.
in USD Europe has still slightly underperfomed the broad US index. If you compare Europe with the Nasdaq 100 performacne the picture is upside down, i.e. Europe is ahead.
Fig. 2: European and US risk premium
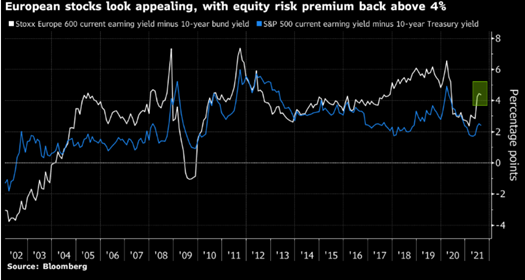
Fig. 3: Strong earnings growth in Europe has pushed markets up while the PE ratio contracted
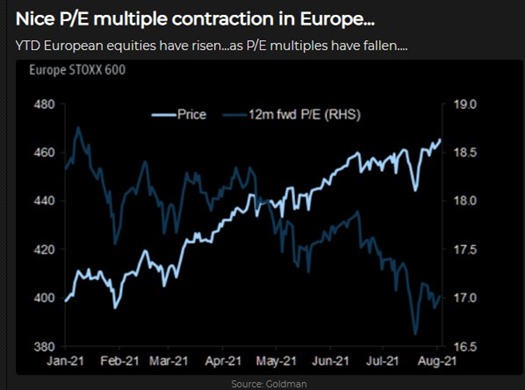
Fig. 4: S&P 500 seasonality price cluster
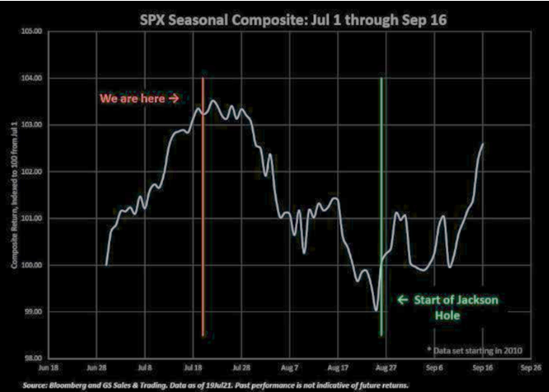
Fig. 5: Measured in USD European equites did slightly underperform the MSCI USA
The key for the next weeks will be where are US yields heading for. After the latest US CPI data, which were lower than one month ago we did see some positive reactions in various markets. However, the PPI data comes shortly after CPI and we might be surprised. Intraday treasury 10-year yield dropped by 5 basis points, which helped gold to stay on a slow but steady recovery path. But these moves can be short lived.
Fig. 6: 10-year treasury yields have risen sharply over the last 5 trading days
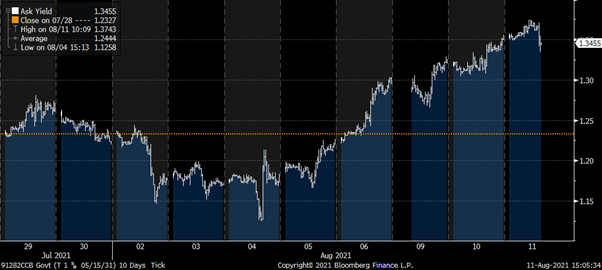
Fig. 7: Gold reacted to the lower CPI data but still trades far below the 1’800 threshold
Therefore, the new narrative is deceleration of US inflation, and the Fed might be right with its narrative that inflation is transitory (i.e., temporary). This gives more support for equites and especially for long duration stocks like the tech sector.
The elephant in the room is the US treasury bond market and the development of its yield. US 10-year real yield keeps being in the negative which nudges investors into risky assets. Nobody knows when we see a pullback, but due to the parked on the sideline liquidity we do believe that any weakness in coming weeks will be used to buy the dip.
Overall, you should stay invested and be globally diversified. Asian equity and bonds might mean revert as they have significantly underperformed the rest of the world. European equites should continue to perform well, but only if the US is not correcting sharply.
Disclaimer: This Blackfort Insights (hereafter «BI») is provided for information purposes only. This document was produced by Blackfort Capital AG (hereafter «BF») with the greatest care and to the best of its knowledge and belief. Although information and data contained in this document originate from sources that are deemed to be reliable, no guarantee is offered regarding the accuracy or completeness. Therefore, BF does not accept any liability for losses that might occur using this information. BI does not purport to contain all the information that may be required to evaluate all the factors that would be relevant for entering into any transaction and anyone hereof should conduct their own investigation and analysis. In addition, the BI includes certain projections and forward-looking statements. Such projections and forward-looking statements are subject to significant business, economic and competitive uncertainties, and contingencies, many of which are beyond the control. Accordingly, there can be no assurance that such projections and forward-looking statements will be actualized. The real results may vary from the anticipated results and such variations may be material. No representations or warranties are made as to the accuracy, or reasonableness of such assumptions, or the projections, or forward-looking statements based thereon. This document is expressly not intended for persons who, due to their nationality or place of residence, are not permitted to access such information under local law. It may not be reproduced either in part or in full without the written permission of BF.
© Blackfort Capital AG. All Rights reserved.
Media about us:
-
-
Capital for The Energy-efficient Renovation of Swiss Homes
Uncorrelated earnings in Swiss Francs and more capital for the energetic refurbishment of Swiss houses – In the interview Wanja Eichl, Managing Partner, explains why Blackfort launches the new Swiss Real Estate Debt Fund. Please check it out via the following INTERVIEW Blackfort Swiss Real Estate Debt_e
-
More Capital for The Energetic Refurbishment of Swiss Real Estate
Contact us
Blackfort Capital AG Blackfort Schweiz AG
Talstrasse 61, 8001 Zurich Prime Tower, 8005 Zurich
Tel. +41 44 585 7878 Tel. +41 44 442 3202


